Crypto Market Daily — June 11, 2026

Crypto Market Daily — June 11, 2026

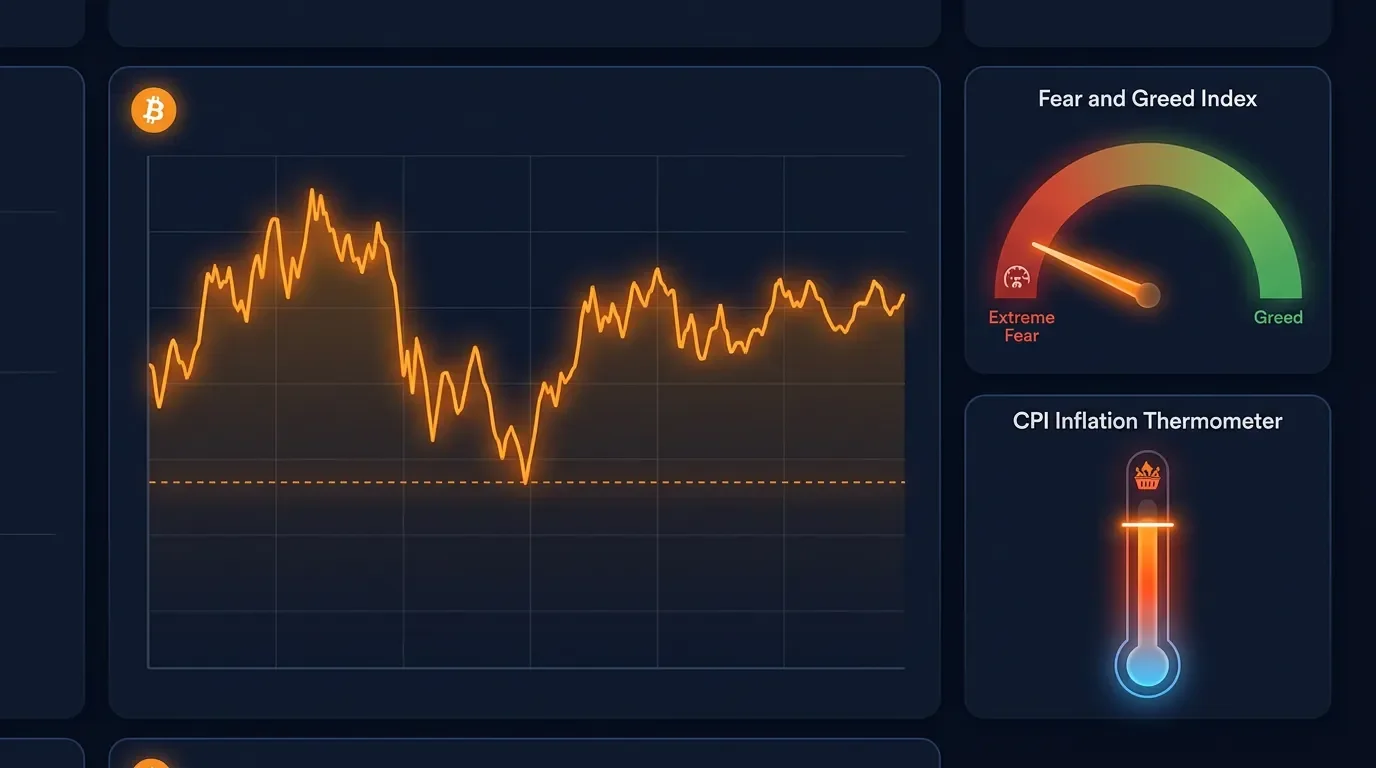
May CPI printed exactly at consensus (4.2% YoY, 0.5% MoM) but softer core inflation (+0.2% MoM vs. +0.3% expected) gave BTC room to bounce above $62,000 before settling at $61,622. Fear & Greed ticks up to 12. BTC ETF outflows decelerated to –$77.4M on Jun 9 and a partial –$69.4M on Jun 10. US May PPI is the next macro test — due today at 8:30 AM ET.

Crypto Market Daily
2026/6/11 · 8:18
購読 6 件 · コンテンツ 21 件
CPI came in at the feared 4.2% — but BTC held $60K, bounced above $62,000 on the softer core print, and slipped back to $61,622 heading into Thursday. Fear & Greed ticked up three points to 12 as US PPI lands today.

Market snapshot

統計カードを読み込んでいます…
The market processed Wednesday's inflation shock faster than most expected. May CPI printed exactly at consensus — 4.2% YoY, 0.5% MoM — the hottest annual rate since April 2023. What gave traders room to defend $60,000 was core inflation: at +0.2% MoM, it came in a tick below the +0.3% consensus, signaling that energy is driving headline prices while demand-driven inflation remains contained. 1
BTC dipped to the $60,000 floor in the hours before the 8:30 AM ET release, then jumped above $62,000 on the softer core read. The bounce was real but short-lived: prices eased back into the $61,600 range overnight. 2

Bitcoin: held the floor, now watching $63,400

BTC sits at $61,622 (–0.19%) heading into Thursday's session. 3 The $60,000 support zone has now been tested three times since June 6 without a decisive close below it — a meaningful observation given that Fear & Greed hit 8 on June 8, the cycle's deepest fear reading.
Resistance remains clustered at $63,400–$64,000. A sustained move through that range would require either a PPI miss to the downside today or a meaningful shift in ETF flow direction. Neither is in place yet.
Key levels to track Thursday:
  • Support: $60,000–$61,000 (recent low: $61,049 on June 10)
  • Resistance: $63,400–$64,000 / $64,100–$65,000

Ethereum: $1,625, still below $1,700 resistance

ETH trades at $1,624.59 (–0.92%). 3 The $1,700 level flipped from support to resistance after June 6's -9.3% session and has not been reclaimed. The $1,540 zone remains the critical support to defend on a next leg down.
ETH ETF flows turned negative again on June 9 at –$40.9M after the June 8 reversal of +$82.4M — ETHA (–$8.5M), ETHE (–$17.4M), and the ETH mini-trust (–$15.0M) were the drags. June 10 data is incomplete (all zeros/dashes). 4

BTC ETF flows: outflows continued through June 10

チャートを読み込んでいます…
June's outflow streak continued, though momentum is fading:
DateTotal net flowKey movers
Jun 8–$91.4MIBIT –$232.9M; ARKB +$63.1M; FBTC +$59.4M
Jun 9–$77.4MIBIT –$61.6M; FBTC –$20.2M
Jun 10–$69.4M (partial)GBTC –$87.9M; MSBT +$17.5M; IBIT/FBTC pending
The daily outflow figure has dropped from –$519M on June 2 to a partial –$69M on June 10. IBIT drove the largest single-day drain on June 8 at –$232.9M, but smaller follow-through on June 9 suggests institutional sellers may be slowing. June 6–7 weekend flows remain unpublished by Farside. 5

Altcoin table

CoinPrice24h
SOL$63.31–2.6%
XRP$1.097–3.4%
BNB$587.64–1.0%
DOGE$0.0831–2.1%
ADA$0.1612–2.9%
ZEC$410.84–4.5%
HYPE$53.35–7.8%
HYPE is the session's notable decliner at –7.8%, extending its pullback from the mid-$60s range it held on June 9. ZEC remains under pressure near $410, still recovering from the Orchard pool exploit that sent it down ~60% on June 6. 3

ETF flows in context

統計カードを読み込んでいます…

Macro: CPI in-line, core beats — but it's not over

Wednesday's CPI confirmed what the bond market had already priced: energy is the primary driver of headline inflation. Gasoline alone is up 40.5% YoY as Iran war supply disruptions compound. Core CPI at +2.9% YoY / +0.2% MoM was a marginal positive surprise relative to consensus. 1 6
The path to Fed rate cuts remains blocked. With headline inflation at a three-year high and the labor market broadly balanced (172,000 jobs added in May), the June 16–17 FOMC meeting is widely expected to result in a hold. Wholesale inflation data — the May PPI — is due today at 8:30 AM ET. Trading Economics consensus puts May Core PPI YoY at 5.2% (down from 5.4% in April), with the PPI index itself slightly softer month-over-month. A below-consensus PPI print today could give risk assets a second sequential catalyst. 7
BTC dominance sits at 55.9%; total market cap is approximately $2.19T.

Signals to watch (next 24–48 hours)

  1. US PPI May 2026 — 8:30 AM ET Thursday: Core PPI consensus 5.2% YoY. A downside surprise would reinforce the narrative that demand-driven inflation is cooling and may trigger another short-cover rally toward $63,000. An upside surprise would re-test $61,000 support before the FOMC.
  2. BTC ETF complete June 9 and partial June 10 data: IBIT, FBTC, and GBTC are still missing from Jun 9 on the Farside table. When complete numbers arrive, they will either confirm the deceleration trend or reveal another large institutional redemption. Thursday's session will also give the first look at post-CPI ETF appetite.
  3. $60,000 floor integrity: Three tests, no decisive close below. If BTC breaks $60,000 on a daily close before PPI or FOMC, downside targets open to $58,000–$59,000. A hold and bounce pattern continues to argue for mean-reversion toward the $63,400 cluster.

このコンテンツについて、さらに観点や背景を補足しましょう。

  • ログインするとコメントできます。